



Tracking profit at the route level is something most cleaning operators never get around to. Company-level, maybe account-level if they're organized — but route-level? Almost never. And that gap is exactly where money disappears.
You can have a healthy account and still lose money servicing it because the route it sits on is badly built. Two stops on the same van — one profitable, one underwater — average out to "fine" on a monthly report. The blend hides the problem. Nobody looks harder because the number isn't scary yet.
The route is the real unit of profit in a cleaning operation. It's where wages, drive time, fuel, supplies, and supervision actually get consumed. If you want to know where your margin goes, you need a micro P&L per route — with clear thresholds that tell a manager exactly when to reschedule, swap the crew, or drop the client.
This post is a working template for doing that. Not company P&L, not account P&L (we covered that in the account-level profitability breakdown). Route-level. The daily loop your area managers can actually run.
What a route-level P&L needs to capture
The whole point is allocating real costs down to the route — not just the company. Here's the structure that works without turning into an accounting project nobody maintains.
Revenue side (per route, per period):
-
Billed value of all stops on the route
-
Any change-order or add-on revenue tied to those stops
Cost side — this is where most people cut corners:
| Cost bucket | How to allocate to a route | Common mistake |
|---|---|---|
| Wages | Actual on-clock hours for the crew running that route, including paid drive time | Using quoted hours instead of real clocked hours |
| Travel | Fuel + mileage + drive-time wages between stops and depot | Ignoring drive time entirely; it's often 15–25% of a route |
| Supplies | Consumables actually used on that route (bags, chemical, paper, pads) | Spreading supplies evenly across all jobs regardless of size |
| Overhead | A per-hour or per-stop allocation of admin, insurance, equipment, supervision | Forgetting it exists, so every route looks more profitable than it is |
The overhead line is the one people push back on most. "That's fixed cost, why load it onto a route?" Because if you don't, you'll keep accepting routes that cover their direct costs but contribute nothing toward the office, the insurance, or your own salary. A route can be cash positive on a direct-cost basis and still be dragging the company down once overhead enters the picture.
A simple, defensible allocation method: take your monthly fixed costs, divide by total billable crew hours, and you get an overhead rate per hour. Load that onto every route by its clocked hours. It's not perfect cost accounting — but it's accurate enough to make real decisions, which is the whole point.
Building the allocation: a worked example
Running through an actual route makes the template less abstract.
Stop losing bookings in operational chaos.
Wipyly helps you manage, confirm, and optimize every cleaning appointment efficiently.
- Centralized booking management
- Automated client notifications
- Staff scheduling & route optimization
No credit card required
Route 14 — Tuesday commercial loop, 5 stops, one 2-person crew, 8:00am–4:30pm.
Revenue:
-
5 stops billed at a combined $640 for the day
Wages:
-
2 cleaners × 8.5 clocked hours × $19/hr = $323
-
(That 8.5 includes roughly 1.4 hours of drive time between stops and back to depot)
Travel (fuel + mileage, drive-time wages already counted above):
-
~46 miles at an all-in vehicle cost of about $0.34/mile = $16
Supplies:
-
Chemical, paper, liners, pad wear actually consumed = $41
Overhead:
-
Overhead rate at approximately $7.50/crew-hour → 17 crew-hours × $7.50 = $128
Route 14 daily P&L:
| Line | Amount |
|---|---|
| Revenue | $640 |
| Wages | –$323 |
| Travel | –$16 |
| Supplies | –$41 |
| Overhead | –$128 |
| Route contribution | $132 |
Route margin: about 20.6%. That's a route you keep and probably don't touch.
Now here's where it gets useful. Suppose one of those five stops is billed at $70 but the crew burns 75 minutes on site plus an extra 20 minutes of drive because it's off the main cluster. That single stop is consuming roughly $60–$65 in wages, travel, and overhead to earn $70. Technically positive by a few dollars — but it's also why the whole route makes $132 instead of something closer to $190. Pull that stop and reroute it to a better-fitting day, and Route 14's margin climbs into the high-20s.
That's what route-level P&L surfaces that account-level analysis never will: the stop that's quietly poisoning an otherwise solid day.
Breakpoints: numbers that trigger a closer look
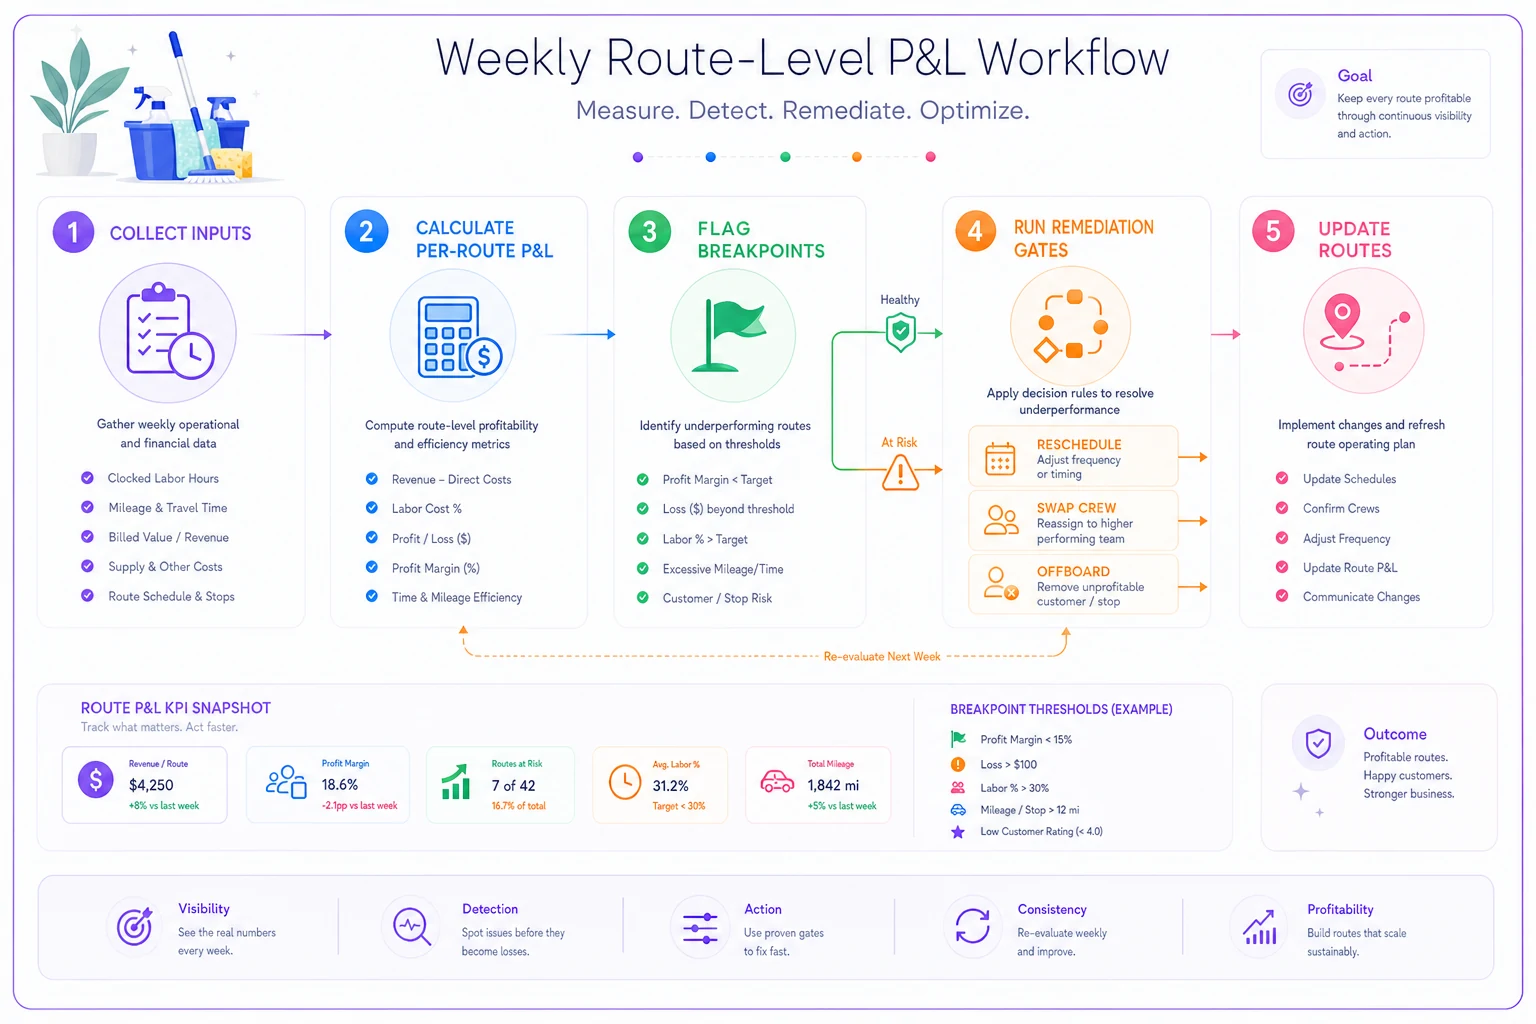
You don't want managers agonizing over every route. You want clear thresholds that flag the ones needing attention without requiring someone to stare at spreadsheets every morning.
-
Route contribution margin under ~12% → flag for review. Below this you're barely covering overhead.
-
Route contribution margin negative → immediate remediation, don't wait for month-end.
-
Drive time over ~22% of clocked hours → routing problem, not a client problem.
-
Any single stop where allocated cost exceeds 90% of its billed value → stop-level remediation needed.
-
Supplies over ~9–10% of route revenue → check for waste, wrong dilution, or an underquoted scope.
The percentages aren't sacred. Set your own once you've run a few weeks of real numbers. The discipline is what matters — a route that trips a breakpoint gets looked at this week, not whenever someone notices the quarterly number sagged.
Drive-time bloat is almost always the first breakpoint to show up, and it's the one people ignore longest because "the guys are still working." They are. They're just driving instead of cleaning, and you're paying cleaning wages for the windshield time.
The remediation gates: reschedule, swap crew, offboard
Once a route trips a breakpoint, you need a decision path so managers aren't improvising. Run it in order — cheapest fixes first.
Gate 1 — Reschedule / re-sequence
First move, always. It costs nothing and fixes more problems than you'd expect. Before touching crew or clients, work through these:
-
Can the stops be re-clustered so drive time drops below your breakpoint?
-
Can a low-margin stop move to a different day where it fits an existing cluster better?
-
Can visit frequency be adjusted to match what the site actually needs?
-
Can the start time shift to avoid traffic or a building's access window?
A lot of "unprofitable routes" are just badly sequenced routes. If re-sequencing moves Route 14's off-cluster stop onto Thursday's loop where the van already passes the door, you're done — no hard conversations required.
If the underlying issue is that you quoted 45 minutes for a job that actually takes 75, that's a quoting problem. The task-level timing tables for deep vs maintenance cleans are the right fix there, not rerouting.
Gate 2 — Swap crew
If re-sequencing doesn't move the route above your breakpoint, look at who's running it. Wages are usually the biggest line, and crew speed varies more than most owners want to admit.
-
Is a slow or still-training crew inflating clocked hours on a route priced for an experienced pace?
-
Would a smaller crew — two instead of three — still hit the SLA on this cluster?
-
Is a strong crew being wasted on a light route where a junior team would clear the same work just fine?
The move isn't about punishing anyone. It's matching crew cost to route difficulty. A three-person team on a route two people can finish by 3pm is a wage overpayment you're choosing to keep making. Swap them onto a heavier route, put a leaner crew on the light one.
Gate 3 — Offboard client (or renegotiate)
This comes last for a reason. You only reach it when re-sequencing and crew changes both failed to push the route above your breakpoint. At that point you've confirmed it can't be made profitable at the current price and scope.
Before offboarding, give the client one renegotiation attempt:
-
Reprice to reflect real cost plus your target margin.
-
Cut frequency or scope to match what they'll actually pay.
-
Move them to a day or route where they stop being the outlier.
If they won't move on price, scope, or schedule and the route stays underwater — offboard. A stop that loses money every week isn't a client relationship worth protecting. Freeing those crew hours for a stop that actually contributes is the better business decision.
When route-level P&L is worth building — and when it isn't
When it makes sense:
-
You run 3+ vans and routes get shuffled regularly
-
Company margin looks fine but you can't explain where the profit actually comes from
-
Drive time and fuel have crept up and you suspect routing more than pricing
-
You're about to add accounts and want to know which routes can absorb them
When it's probably overkill:
-
You run one van with a fixed daily route that never changes — just watch the account P&L
-
You don't yet track clocked hours reliably — fix your time data first; route P&L built on quoted hours is fiction
-
Your stop data is a mess mid-migration
If you can't tie labor hours to specific stops with reasonable accuracy, don't build this yet. Get clocked-hours-per-stop nailed down first, then come back to the route layer.
A real scenario
A commercial cleaner running six vans and around 40 recurring accounts had solid company margins on paper — mid-30s gross — but the owner couldn't reconcile why cash never matched the reports.
They built route P&Ls for two weeks. Four of eleven routes were tripping the drive-time breakpoint, one was flat negative once overhead was loaded, and two of the "good" routes each had a single stop eating 85–90% of its own billed value.
They ran the gates in order. Re-sequencing fixed three of the four drive-time routes and pulled the two problem stops onto days where the van already passed nearby. The negative route got a crew swap — three-person down to two — plus a small reprice on one account, which moved it from roughly –4% to around +14%. One client refused any adjustment on scope or pricing and got offboarded. Those freed hours went to a waitlisted account that dropped cleanly onto an existing cluster.
Over the following quarter: no meaningful revenue jump, but route contribution tightened across the board and the owner stopped losing roughly $2k–$3k a month to routes that had been hiding inside a healthy-looking average.
That's the whole value. Not more revenue — the same revenue, delivered without the quiet leaks.
Keeping the loop running
The template only works if it runs on a real cadence. Route P&Ls built once and abandoned are almost worse than nothing — they give false confidence. Rebuild them monthly, flag breakpoints weekly, and run the three gates the moment a route trips one.
Managing all of this by hand across a dozen routes gets heavy fast. Operational software that pulls clocked hours, mileage, and billed value into a per-route view earns its keep here — not because it's clever, but because it makes the weekly flag-and-fix cycle something a manager will actually sustain past month two instead of quietly letting slide.
Rebuild them monthly and flag breakpoints weekly so small issues don't compound into hidden monthly losses.
Route-level P&L doesn't ask you to price differently or hire differently. It just refuses to let a bad route hide inside a good average — and gives your managers a clear, ordered set of moves the moment one shows up.
Route-level P&L doesn't ask you to price differently or hire differently. It just refuses to let a bad route hide inside a good average — and gives your managers a clear, ordered set of moves the moment one shows up.
Ready to simplify your cleaning operations?
Join 1,000+ cleaning businesses using Wipyly to save time, reduce scheduling conflicts, and enhance client satisfaction.