


Most cleaning operators track KPIs. Very few track them in a way that actually tells them whether a specific account is healthy or quietly dying. The reason is simple: a first-time-quality score of 92% is excellent on a $900/month retail strip mall and borderline dangerous on a $14,000/month surgical center. Same number. Two entirely different stories.
When you average performance across an entire book of business, you flatten out exactly the signal you need. A portfolio that looks "fine" at the top line is almost always hiding two or three accounts bleeding margin — and two or three accounts you could grow if you actually noticed how well they were running. Benchmarks only become useful once you stop asking "how are we doing?" and start asking "how are we doing for this type of contract, at this size, at this frequency?"
That's the whole idea behind percentile-based benchmarks segmented by vertical, contract size, and service frequency. Instead of one target for everything, you build a grid. Then you diagnose against the right cell in the grid — not against some company-wide average that describes no real account.
The problem with a single benchmark
Say you set a company standard: complaints per 1,000 cleans should stay under 4. Sounds reasonable. Now look at what that hides.
A daily-frequency healthcare account generates far more cleans per month than a weekly office account, so the same complaint rate represents a wildly different absolute number of failures — and in healthcare, the tolerance for failure is much lower to begin with. Meanwhile your once-a-week small office might hit that same rate off a single grumpy tenant, which tells you almost nothing about the account's real health.
-
Vertical — healthcare, retail, office (each has different failure costs and inspection intensity)
-
Contract size — because a $1k account and a $15k account deserve different scrutiny and different acceptable variance
-
Frequency — daily, several-times-weekly, weekly, or periodic, since frequency changes both exposure and the client's expectation of consistency
Once you have those three axes, you stop comparing apples to fire trucks.
Why percentiles beat flat targets
Flat targets ("hit 95%") assume you already know what good looks like. Most operators don't — not with real numbers behind it. Percentiles let your own book of business tell you what's achievable, then you manage against that distribution.
Stop losing bookings in operational chaos.
Wipyly helps you manage, confirm, and optimize every cleaning appointment efficiently.
- Centralized booking management
- Automated client notifications
- Staff scheduling & route optimization
No credit card required
The practical version: pull the last 6–12 months of data for each segment. Sort each metric. Now you can define:
-
Top quartile (75th percentile and above) — your reference for what's genuinely achievable in that segment
-
Median (50th) — the honest middle
-
Bottom quartile (25th and below) — your intervention zone
An account sitting in the bottom quartile for its own segment needs attention, regardless of how it looks against a company average. This matters because a mediocre office account and a mediocre healthcare account require completely different responses — a flat target would have flagged them identically, or missed one entirely.
If you haven't nailed down which metrics to track first, it's worth grounding this in the core set — the ones that actually predict whether a contract renews. We walked through that in the 8 cleaning KPIs that predict contract performance, and percentile benchmarking sits directly on top of that foundation. You pick the KPIs there, you build the distribution here.
A starting benchmark grid
These aren't laws of physics — they're realistic starting bands drawn from how contracts of different types tend to behave. Adjust them to your own data as it accumulates. The point is the shape: notice how the targets tighten as failure cost and frequency rise.
| Segment (vertical / size / freq) | First-time quality (top quartile) | Complaints per 1k cleans (median) | On-time completion | Inspection/audit pass |
|---|---|---|---|---|
| Healthcare / large / daily | 97–99% | under 1.5 | 98%+ | 95%+ |
| Healthcare / mid / 3–5x wk | 96–98% | under 2.5 | 96%+ | 93%+ |
| Retail / large / daily | 92–95% | 3–5 | 95%+ | 88%+ |
| Retail / small / weekly | 88–92% | 4–7 | 92%+ | 85%+ |
| Office / large / daily | 93–96% | 2–4 | 96%+ | 90%+ |
| Office / small / weekly | 90–93% | 3–6 | 93%+ | 87%+ |
A few things worth pointing out. The complaint tolerance for a small weekly retail account (4–7 per 1k) looks alarming next to healthcare, but retail traffic and public-facing surfaces generate visible mess fast, and clients expect a different standard. Holding a strip-mall account to surgical-center numbers just burns labor hours you'll never recover. On the flip side, if a daily healthcare account is running complaints per 1k anywhere near 5, that's not a coaching issue — that's a "we might lose this contract and possibly should" conversation.
The size adjustment also matters. Large accounts get tighter targets not because the work is harder but because the consequence of drift is bigger. Losing a $15k account and losing a $1k account are not the same event, so they don't earn the same margin of error.
Diagnostic checklists for underperforming segments
When an account lands in the bottom quartile, resist the urge to guess. The failure pattern is usually specific to the vertical. Run the matching checklist first.
Healthcare underperformance
Healthcare failures are rarely about effort. They're about protocol, documentation, and consistency under high frequency.
-
Are infection-control and touchpoint protocols actually being followed, or just listed on the SOP?
-
Is the failure concentrated on specific shifts or specific staff, or spread evenly? (Concentrated usually means training or staffing; spread usually means a scope or time problem.)
-
Are audit failures clustering on the same zones — patient rooms vs. common areas vs. restrooms?
-
Is documentation and evidence capture keeping pace, or are cleans happening but not being proven?
-
Has frequency crept beyond what the labor allocation actually supports?
Healthcare and other regulated sites have hard, non-negotiable requirements that a generic office checklist will never catch. If you're building segment-specific standards, the regulatory frequency rules and audit checkpoints in our site playbooks for healthcare, education and retail pair directly with these diagnostics.
Retail underperformance
Retail problems are usually about timing, visibility, and traffic — not skill.
-
Are cleans scheduled around store traffic, or fighting it? A floor cleaned before the morning rush looks worse by noon than one cleaned after close.
-
Is the complaint source the store manager, corporate, or foot-traffic customers? Each means something different.
-
Are high-visibility zones — entrance glass, restrooms, front-of-house — getting disproportionate attention, or being treated the same as the stockroom?
-
Is the account's scope matched to actual traffic, or was it priced off an off-peak walkthrough?
Office underperformance
Office accounts tend to fail quietly.
-
Is the drop tied to a change in tenant density or return-to-office patterns?
-
Are complaints about the same recurring details — trash not fully emptied, conference rooms missed, restroom restocking?
-
Has the account been coasting — same crew, same routine, slow quality creep no one flagged?
-
Is the point of contact still the person who signed the contract, or a new facilities manager with different expectations?
The client stops noticing you in a good way and starts noticing you in a bad way.
A repeatable remediation workflow
Once the checklist points you at a cause, run the same loop regardless of vertical. What changes is the target — a bottom-quartile account is trying to reach its segment median, not some universal number.
-
Confirm the segment and pull the right percentile band. Don't diagnose against the wrong grid cell. A daily healthcare account gets compared to daily healthcare accounts.
-
Isolate the failure signal. Is it quality, timeliness, complaints, or audit pass? One metric usually leads; the others follow.
-
Run the vertical checklist above and write down the single most likely root cause. Not five. One to start.
-
Set a 30-day target at the segment median, not the top quartile. Stop the bleed first, then improve.
-
Assign one owner and one change. Multiple simultaneous changes make it impossible to know what worked.
-
Re-measure at 30 days. If it moved toward median, keep going. If it didn't, the root cause diagnosis was wrong — go back to step 3.
-
Escalate the decision if two cycles fail. At that point the account may need a renegotiation or offboard conversation, not more labor.
That last step is the one operators skip most often. Some bottom-quartile accounts aren't fixable at the current price — the scope was underbid or the frequency doesn't match the labor. Pouring hours into them just moves the loss around. Knowing when to stop remediating and start renegotiating is part of the system too.
Assign a single owner to any remediation change so you can isolate what worked.
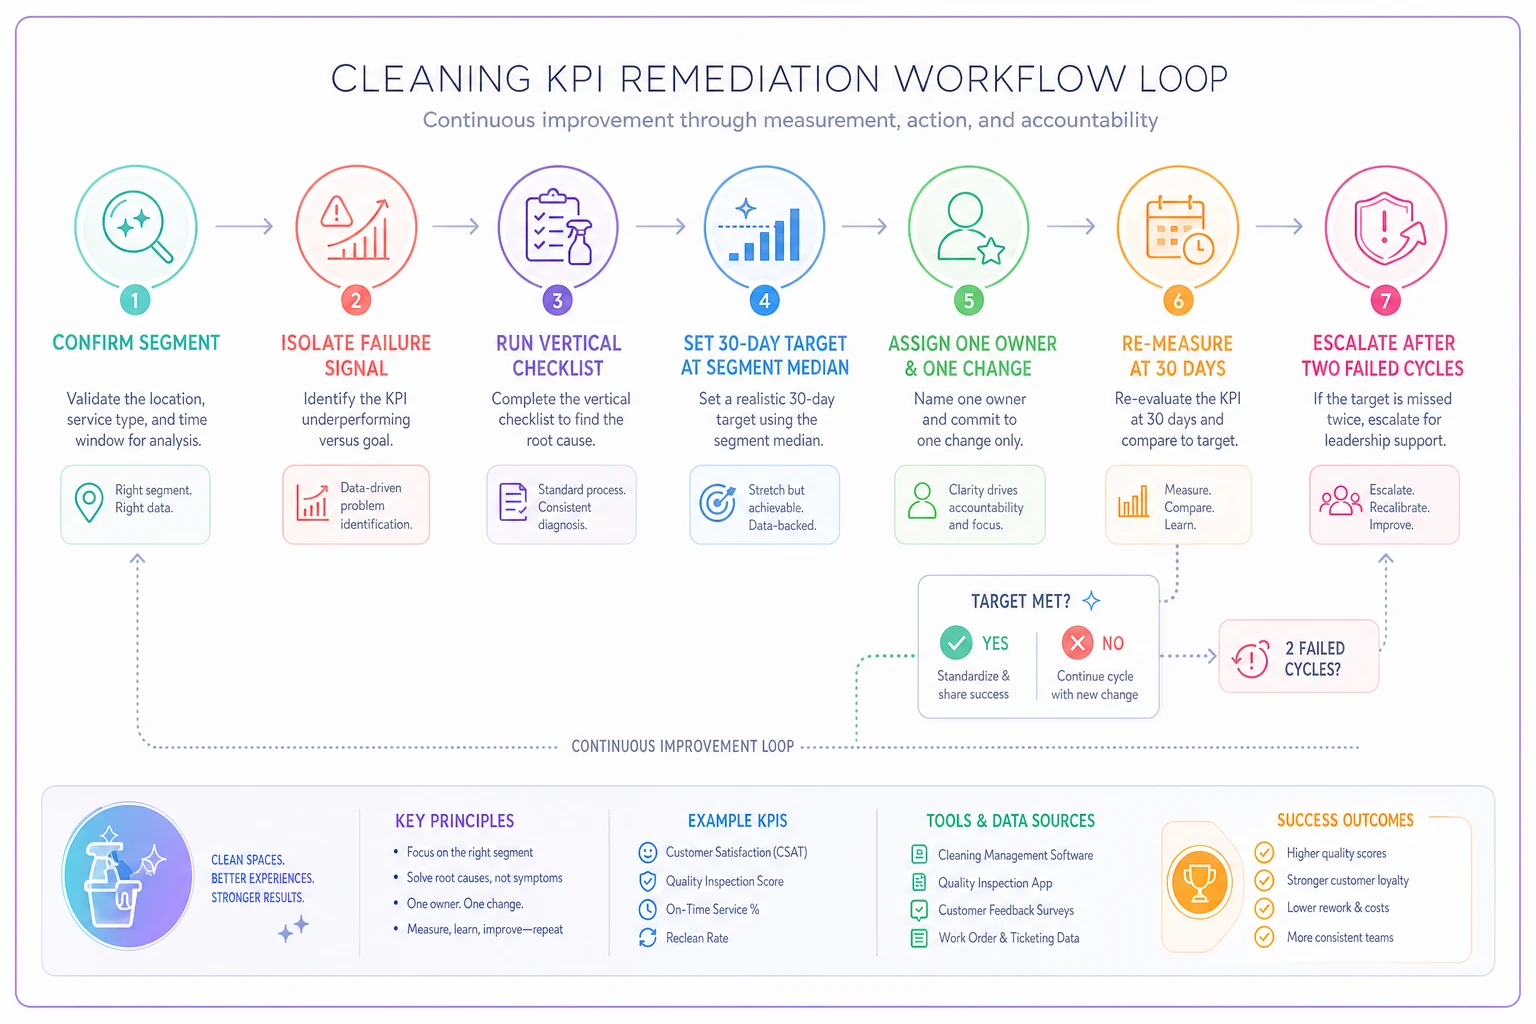
Use the loop consistently to stop guessing and to standardize remediation across segments.
A real scenario
A mid-sized janitorial company running roughly 40 commercial accounts had a company-wide first-time-quality target of 93%. On paper they were hitting it — portfolio average sat around 93–94%, so nobody worried.
When they broke the book into segments, the picture changed. Their three healthcare accounts — the highest-paying contracts in the portfolio, together worth close to $38k/month — were averaging around 91% first-time quality. Against a flat 93% target that looked like a rounding error. Against the healthcare segment benchmark (where top quartile was sitting near 97%), those accounts were in their own bottom quartile.
Digging in with the healthcare checklist, the failures clustered on two things: patient-room touchpoints on the overnight shift, and evidence capture that was spotty enough they couldn't prove work during audits. One crew, one shift, one documentation gap. They set a 30-day target at their healthcare median (~96%), assigned the night supervisor as owner, and tightened the touchpoint routine plus the photo evidence step.
Two cycles later those accounts were running in the mid-96s — and the client's quarterly audit passed cleanly for the first time in a while. Nothing dramatic happened to the portfolio average. But the segment view caught a real risk on nearly $460k of annual revenue that the blended number had completely buried.
When this approach makes sense — and when it doesn't
This works well once you have enough accounts and enough history to build real distributions. Somewhere north of 15–20 accounts with 6+ months of data, percentiles start telling the truth. Below that, the sample is too thin — a single bad month distorts the whole band, and you're better off benchmarking against explicit client SLAs and a handful of manual targets.
It's also not worth the overhead if your data is inconsistent. Percentiles built on half-captured records just give you confident-looking garbage. Clean, consistently structured KPI capture has to come first.
And a caution: don't turn percentiles into a stick. The point of flagging a bottom-quartile account isn't to punish a crew — it's to route attention. Plenty of bottom-quartile accounts are underperforming because they were underpriced or under-scoped, which is a management decision, not a crew failure.
Where software quietly helps
None of this requires software to be correct — you can build the grid in a spreadsheet. But it gets painful fast by hand. Recomputing percentiles across segments every month, re-slicing by size and frequency, flagging which accounts crossed into the bottom quartile since last period — that's exactly the kind of repetitive reconciliation where an operational platform earns its keep. AI-assisted operational software can pull KPI data into consistent segments automatically, recalculate distributions, and surface accounts that moved into an intervention band before a client escalates. That turns a monthly manual audit into a standing alert, so managers spend time on the diagnostic and remediation steps instead of rebuilding the report.
The value isn't automation for its own sake. It's that the segment view stops being a quarterly project you dread and becomes something that's just always current — which is the only version of benchmarking that actually changes decisions.
Pulling it together
The core shift is small but it changes everything downstream: stop asking whether the portfolio is healthy and start asking whether each contract is healthy for what it is. A percentile grid segmented by vertical, size, and frequency turns vague averages into specific, actionable signals. The diagnostic checklists tell you where to look once an account slips. The remediation loop keeps you from guessing. And knowing when to escalate keeps you from throwing labor at accounts that were never priced to succeed.
Build the grid off the KPIs that actually predict renewals, layer the vertical-specific standards on top, and the same data you're already collecting starts telling you the truth it was hiding inside the average.
The core shift is small but it changes everything downstream: stop asking whether the portfolio is healthy and start asking whether each contract is healthy for what it is. A percentile grid segmented by vertical, size, and frequency turns vague averages into specific, actionable signals. The diagnostic checklists tell you where to look once an account slips. The remediation loop keeps you from guessing. And knowing when to escalate keeps you from throwing labor at accounts that were never priced to succeed.
Build the grid off the KPIs that actually predict renewals, layer the vertical-specific standards on top, and the same data you're already collecting starts telling you the truth it was hiding inside the average.
Ready to simplify your cleaning operations?
Join 1,000+ cleaning businesses using Wipyly to save time, reduce scheduling conflicts, and enhance client satisfaction.