


Most cleaning operators inspect QA one of two ways: either everything gets a walk-through (impossible past a handful of sites), or someone eyeballs "a few" accounts a month with no real logic behind which ones. Both approaches fall apart the moment you're running 20+ contracts with crews you don't personally see every day.
The problem isn't that you're not inspecting. It's that your inspection coverage has no statistical backbone. You check 4 of 30 sites, find them clean, and quietly assume the other 26 are fine. Then a national account pulls three surprise audits in a bad building and you're on a cure-period call explaining why your "QA program" missed it.
This post is about building a sampling plan that actually tells you something — random and stratified templates, sample sizes that scale with contract size, worked examples for small and medium portfolios, and clear rules that turn a sample result into a root-cause investigation and a remediation cadence.
Why "spot checks" give you false confidence
Here's the uncomfortable math. If 20% of your site-visits are actually below standard and you inspect 4 random sites, there's roughly a one-in-three chance all four come back clean. You'd walk away thinking you're at 100% — while a fifth of your delivery is quietly failing.
That gap is where SLA penalties and silent churn live. The client experiences the 20%. You measured the 80%.
In real operations, inspection volume usually gets set by who has time this week, not by how much coverage we actually need to trust the number. Area managers inspect sites that are easy to reach, or the ones that complained recently. Easy-to-reach and recently-complained are the two least representative samples you can possibly pick.
A proper sampling plan fixes two things at once:
-
Selection bias — which sites get picked (random or stratified, not convenient)
-
Coverage — how many get picked (tied to portfolio size and contract risk)
Get both right and your monthly QA score becomes something you can actually defend in a renewal meeting.
Random vs stratified: pick the right template
There are two sampling approaches worth running. Most operators should use a blend.
Stop losing bookings in operational chaos.
Wipyly helps you manage, confirm, and optimize every cleaning appointment efficiently.
- Centralized booking management
- Automated client notifications
- Staff scheduling & route optimization
No credit card required
Random sampling means every site has an equal chance of being inspected this cycle. It's unbiased and easy to defend, but on a mixed portfolio it can over-sample your low-risk offices and under-sample the three hospitals that could sink you.
Stratified sampling splits your portfolio into groups (strata) and samples within each. You inspect proportionally more from the high-risk, high-penalty strata.
| Approach | Best for | Weakness | When to use |
|---|---|---|---|
| Simple random | Uniform portfolios (e.g., 25 similar small offices) | Can miss rare high-risk sites | Early-stage, homogenous books |
| Stratified by risk | Mixed portfolios (healthcare + retail + office) | Takes setup to define strata | Most operators past ~15 sites |
| Stratified by contract value | Books where penalty exposure varies widely | Ignores operational difficulty | Heavy SLA-penalty contracts |
| Stratified + random within strata | The realistic default | Slightly more admin | Almost everyone at scale |
The practical rule: stratify by whatever hurts most when it fails. If penalties are your pain, stratify by contract value. If complaints and regulatory risk keep you up at night, stratify by site type.
A typical stratification for a 30-site book looks like this:
-
Stratum A — High risk/high penalty 5 sites (healthcare, flagship accounts)
-
Stratum B — Medium 10 sites (mid-size commercial, retail)
-
Stratum C — Low 15 sites (small offices, low-traffic)
You then sample more heavily from A than C — even though A is the smallest group.
Sample-size calculator tied to contract size
You don't need a statistics degree, but you do need a rule that isn't "whatever feels right."
The working logic most operators can run with: pick a confidence target and an acceptable defect rate, then let portfolio size drive the count.
-
Set your acceptable quality level (AQL). For most commercial cleaning, 5–10% below-standard as your action threshold is realistic. Tighter — 2–3% — for healthcare.
-
Set confidence. 90% is fine for internal QA. 95% if the contract has audit teeth.
-
Scale the sample to the stratum, not the whole book. This is where most people go wrong — they calculate one number for 30 sites and spread it evenly.
For small portfolios, you can skip formulas and use this lookup:
| Stratum size | Low-risk sample (per cycle) | High-risk sample (per cycle) |
|---|---|---|
| 1–5 sites | 2 | all / rotate so each hit every 2 cycles |
| 6–10 sites | 3 | 5 |
| 11–20 sites | 4–5 | 7–8 |
| 21–40 sites | 6–7 | 10–12 |
The high-risk column intentionally covers a much larger fraction. A 5-site healthcare stratum getting fully inspected every cycle is correct — the cost of a miss there dwarfs the inspection cost.
Sample size per stratum = ROUNDUP( stratumsites riskmultiplier coveragefactor , 0 ) where: coveragefactor ≈ 0.20 (low), 0.40 (medium), 0.70+ (high risk) risk_multiplier bumps strata tied to penalty-heavy contracts
Drop your site list into three columns (site, stratum, contract value), and that one formula generates your monthly inspection count per stratum automatically.
Worked example: a 12-site small portfolio
A realistic small operator — roughly $40k–$50k monthly revenue, 12 sites, one owner-operator plus a part-time supervisor doing QA.
Portfolio breakdown:
-
2 medical clinics (high risk)
-
4 mid-size retail (medium)
-
6 small offices (low)
Monthly sampling plan:
-
Clinics
inspect both every month (2)
-
Retail
inspect 2 of 4, rotating (2)
-
Offices
inspect 2 of 6, random draw (2)
That's 6 inspections a month — totally doable for a part-timer — and over a quarter every site gets touched at least once, while the clinics get full coverage every cycle.
Before this kind of structure, the supervisor was doing "4-ish" inspections, almost always the two retail sites nearest the office and whichever clinic had complained. The 6 small offices went months without a single check. When one lost its contract, nobody had set foot in it for 11 weeks.
After moving to the stratified draw, the first quarter surfaced two below-standard offices that had been completely invisible. Fixing them early likely saved one renewal. No new headcount — just better selection.
Worked example: a 30-site medium portfolio
A medium operator, roughly 30 sites, two area managers.
Strata:
-
5 high (healthcare + flagship corporate)
-
10 medium
-
15 low
Using the coverage factors:
-
High
5 × 0.70 → 4 sites/cycle (rotate so all 5 hit within ~1.5 cycles; or just inspect all 5)
-
Medium
10 × 0.40 → 4 sites/cycle
-
Low
15 × 0.20 → 3 sites/cycle
That's ~11 inspections/cycle, split across two managers — about 5–6 each. Realistic.
The insight most operators miss: at 30 sites, inspecting 11 correctly selected sites tells you more than inspecting 20 conveniently selected ones. Representativeness beats raw volume. Twenty biased inspections still measure the wrong 80%.
Turning a sample result into action: the RCA + remediation rules
A sample score sitting in a spreadsheet does nothing. The value is in the decision rules that fire when a result comes in. This is where sampling connects to root cause and a remediation clock.
Here's the mapping most operators can adopt directly:
| Sample outcome (stratum) | Interpretation | Action | Remediation cadence |
|---|---|---|---|
| 0 failures | In control | Log, continue normal cycle | Next scheduled cycle |
| 1 failure, low stratum | Isolated | Site-level fix, re-inspect | Re-check within 2 weeks |
| 1 failure, high stratum | Serious | Trigger RCA, notify account owner | Re-inspect within 5 days |
| 2+ failures, same stratum | Systemic signal | Expand the sample in that stratum | RCA within 72h, re-sample this cycle |
| Repeat failure, same site | Chronic | Full RCA + crew/coaching review | 30/60/90 tracking |
The rule that earns its keep is "2+ failures = expand the sample." When two inspected sites in a stratum fail, you don't assume the rest are fine — you assume you've found a pattern and inspect more to size it. That single rule prevents the classic mistake of treating a systemic failure as two unlucky one-offs.
For anything that trips an RCA, don't improvise the investigation. The RCA playbook for cleaning teams with photo standards and a 30/60/90 tracker lays out exactly how to run the root-cause step and track whether the fix held past the first re-check.
The full workflow, start to finish
Running this well isn't complicated, but it does need to happen in the same order every cycle — otherwise someone inevitably skips the random draw and goes back to inspecting whatever's convenient.
The diagram below shows the monthly cycle and how each step flows to the next.
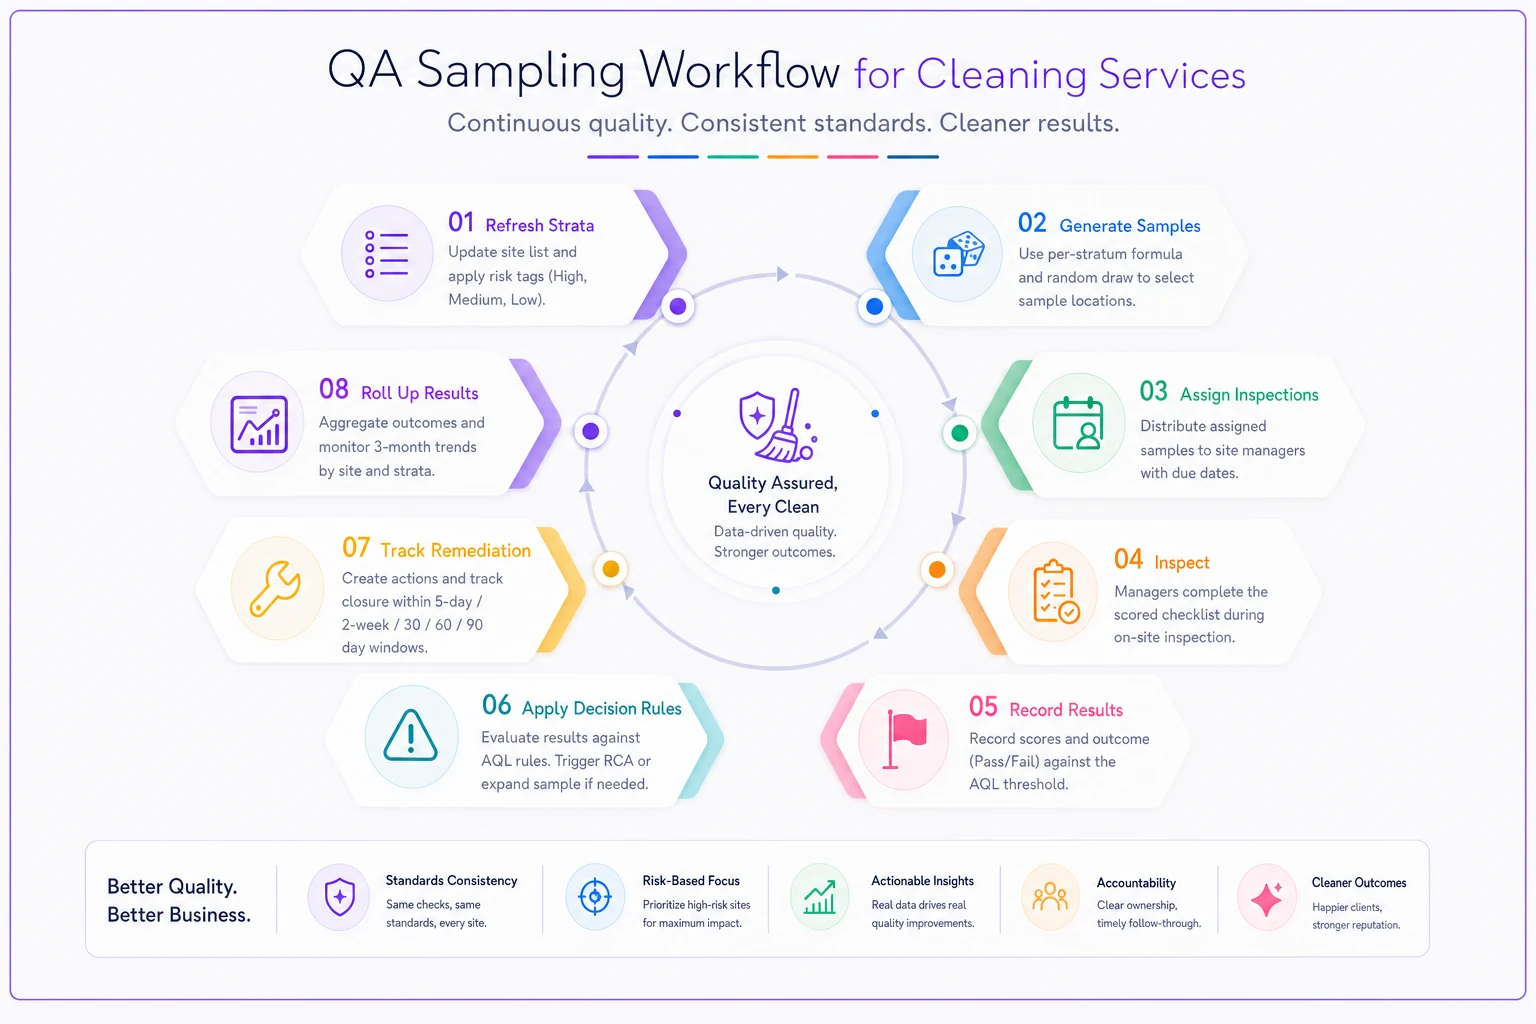
Follow these steps each cycle:
-
Refresh strata — update site list and risk tags (contracts added/lost, risk changes).
-
Generate samples — run the per-stratum formula; random-draw within each stratum.
-
Assign inspections — distribute across managers; lock the list so nobody swaps for convenience.
-
Inspect against a scored checklist — same rubric every time, so scores compare across sites.
-
Record pass/fail per site against your AQL threshold.
-
Apply the decision rules — fire RCA, expand sample, or continue as the table dictates.
-
Track remediation on the cadence (5-day, 2-week, or 30/60/90 depending on severity).
-
Roll results up into your QA trend so you're watching direction, not just this month's number.
That roll-up matters more than any single cycle. One clean month proves nothing; a stable three-month trend across properly selected samples is what you take into a renewal. If you're building that dashboard, these cleaning KPIs that predict contract performance are the ones to feed your sampling results into.
Keeping all of this in a shared workbook or ops platform — rather than one person's spreadsheet — is what makes it survive a busy month. When the selection logic and remediation timers run on a schedule instead of depending on someone remembering to check in, the plan actually holds. That's the real difference between a QA system and a good intention that collapses under pressure.
When this makes sense — and when it doesn't
Worth doing if:
-
You run more than ~10 sites and can't personally walk them all.
-
You have penalty-bearing or regulated contracts (healthcare, food, national accounts).
-
Your QA coverage currently depends on who's free and what's nearby.
Probably overkill if:
-
You're running 3–5 sites you visit weekly anyway. Just inspect them all — sampling solves a coverage problem you don't have yet.
-
Your contracts have no audit or penalty exposure and churn is already near zero.
Who should NOT bolt this on blindly:
Operators without a consistent scored checklist. Sampling tells you which sites to inspect; it assumes your inspection itself is standardized. If two managers score the same site differently, fix the rubric first — otherwise you're sampling noise, and a bigger sample just gives you more of it.
The quick-start checklist
A compact checklist to get your sampling plan running:
-
[ ] List every site with contract value and risk level
-
[ ] Group into 3 strata (high / medium / low)
-
[ ] Set your AQL threshold (5–10% general, 2–3% healthcare)
-
[ ] Apply coverage factors to get a per-stratum sample count
-
[ ] Random-draw within each stratum each cycle (no hand-picking)
-
[ ] Inspect against one shared scored checklist
-
[ ] Apply the outcome → RCA → cadence rules
-
[ ] Track remediation on 5-day / 2-week / 30-60-90 timers
-
[ ] Roll results into a rolling 3-month QA trend
Use this list as your operational checklist each cycle; tick items off and keep the plan visible to the whole team.
The real shift
The move here isn't "inspect more." Plenty of operators running high inspection volume are still flying blind — because they keep going back to the same sites for the wrong reasons. The shift is from convenient coverage to representative coverage: choosing sites by risk and chance instead of proximity and complaints, then letting clear rules decide what a result actually means.
Do that, and your QA number stops being a guess you hope holds up and becomes something you'd put in front of a client mid-audit without flinching. That confidence — knowing your sample actually reflects your delivery — is worth far more than the hour a month it takes to run the draw.
Do that, and your QA number stops being a guess you hope holds up and becomes something you'd put in front of a client mid-audit without flinching. That confidence — knowing your sample actually reflects your delivery — is worth far more than the hour a month it takes to run the draw.
Ready to simplify your cleaning operations?
Join 1,000+ cleaning businesses using Wipyly to save time, reduce scheduling conflicts, and enhance client satisfaction.